
Joel VanderWerfjoelvanderwerf@mastodon.social
Sep 27, 2026, 10:31 AM@futurebird Well, at least we can still rely on the Washington Post to hold up a high standard of graphic design. (This was yesterday, I believe.)
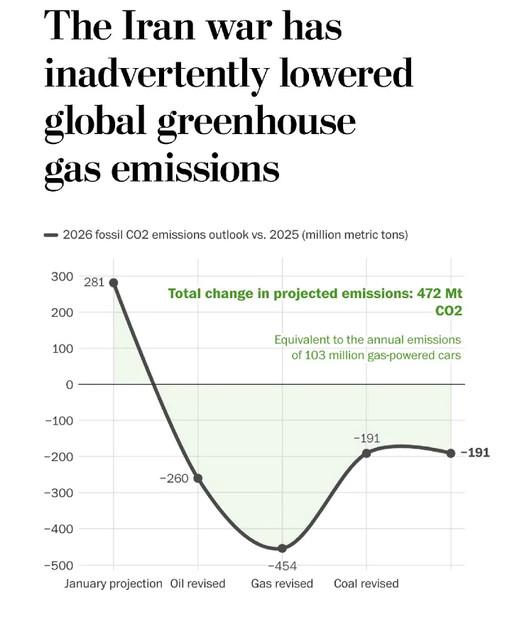
@futurebird Well, at least we can still rely on the Washington Post to hold up a high standard of graphic design. (This was yesterday, I believe.)

@joelvanderwerf @futurebird
I do not have time to do any analysis, but i would like the raw data that leads to that graph.
It feels too simplified.

Presenting lower emissions as bad because it represents less "economic activity?"
@futurebird Only that it's not clear what the x-axis even is, or why data points are connected by a smooth curve.
Why is it shaded in?
@futurebird I guess that is the difference between 2025 and 2026 values? But then why are negative and positive differences shown in the same color??