 Jul 6, 2026, 7:01 AM
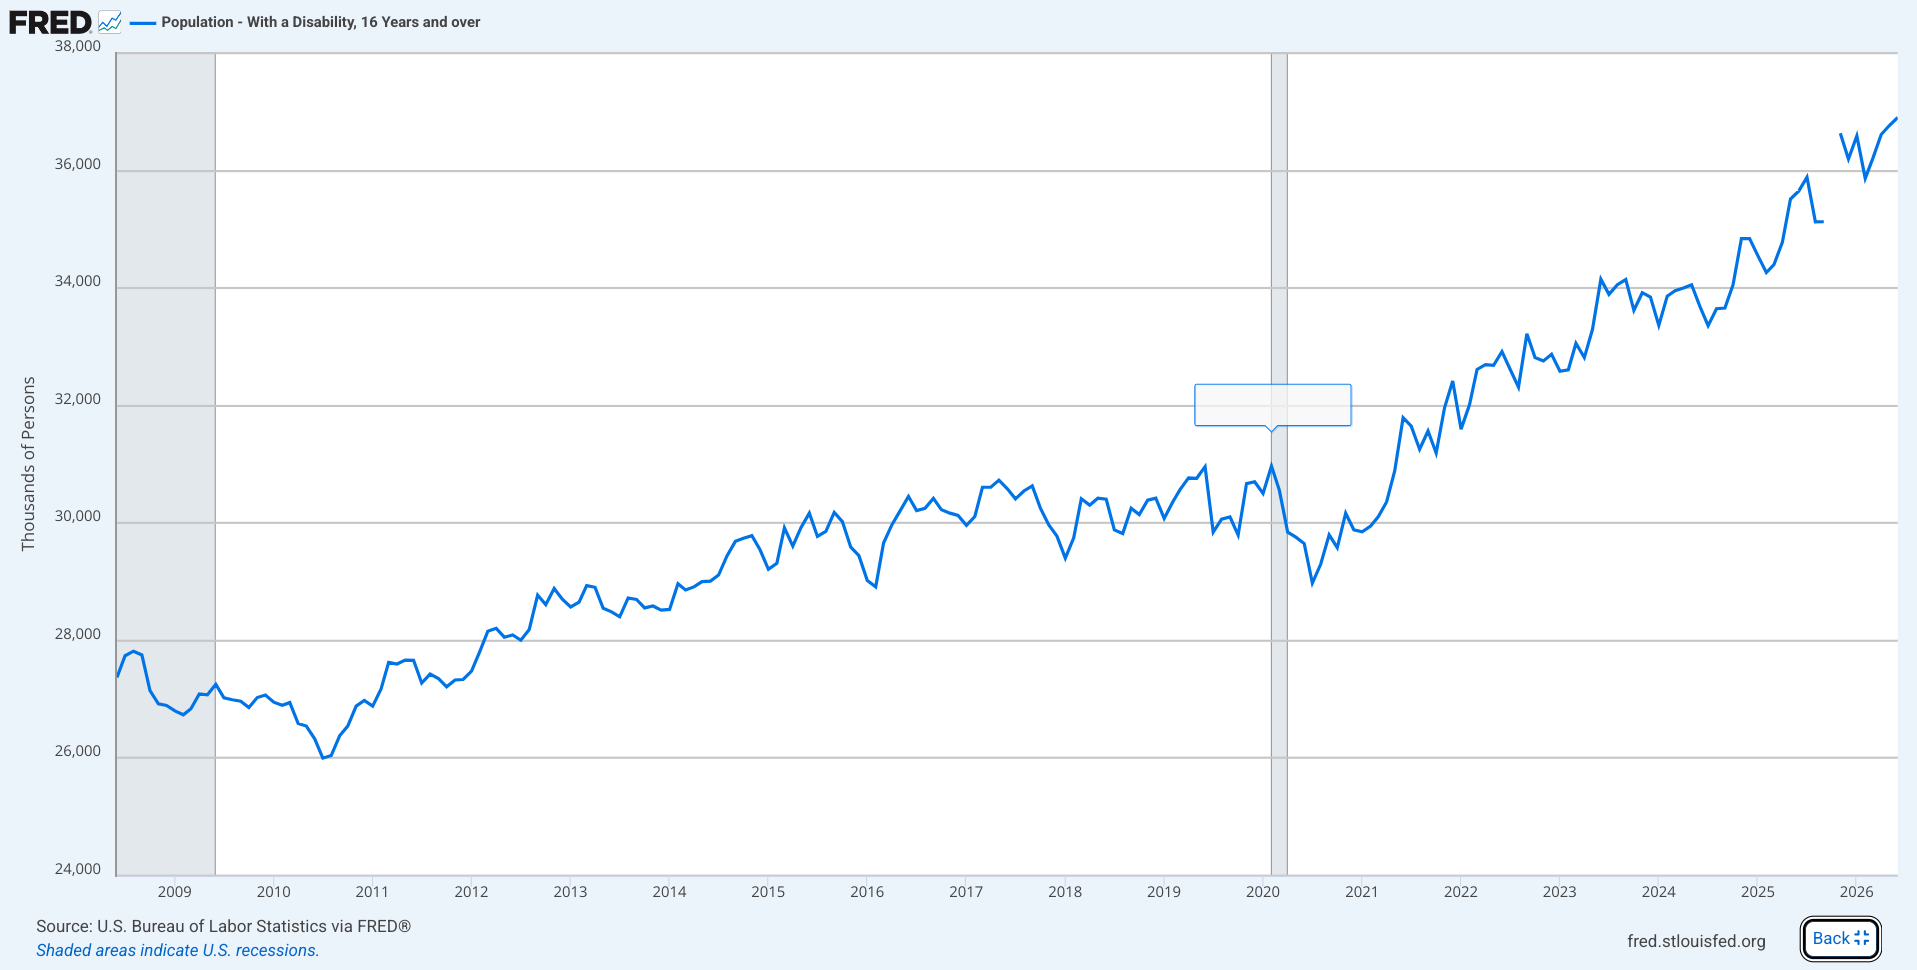
The Labor Bureau's 'Current Population Survey (Household Survey)' saw a nearly 1.14 million increase between the end of the recession in 2008 and the beginning of the pandemic in 2020. This amounting to an average increase in the disabled population of less than 94 thousand a year.
For the period from April 2020 to date, that figure has climbed nearly 1.24 million, for an average increase in the disabled population of over 200 thousand a year, with no sign of slowing. Disability has climbed faster in the past half dozen years than it had in the previous dozen.
Another way to say all of this is that disability has been increasing at twice the pre-pandemic rate for six years straight, and continues to do so as we enter the pandemic's seventh year.
![Chart: Est. & Reported U.S. Covid Variant Proportions by Common Name
Sources: CDC, Cov-Lineages, NYITCOM, others
[ beadsland on Ko-fi ]
Reskin of CDC's Variants Nowcast, and any significant variants in GISAID not broken out by CDC.
Four bar-style tree-charts, for four-week periods through 5/10–6/6. Legend of last four-week period, organized by subheadings of color-grouped families and convergent clusters. Percentages overlay each color key, reflecting share as of most recent tree-chart.
Over nine tenths Omicron B.1.1.529 / BA dynasty. LP.8.1.2 / NW family accounts for over two thirds share; Stratus-Eleventy XFG.1.1 for over a quarter.
For 2/15–3/14, packed bubble charts fill single-variant tiles, reflecting GISAID detail not shown by CDC's Nowcast.
Legend:
FDA-Vaccine-Target [purples]:
29% - XFG.1.1.1 / RP† & other Stratus-Eleventy XFG.1.1
8% - XFG.14.1, XFG.2.5.1 & XFG.14.1.1†
8% - XFG.6
1% - XFG.10.4
7% - XFV & other Stratus XFG
0% - other FDA-Vaccine-Target LP.8.1
XFG.23.1.3 [reds]:
6% - RV.1
9% - other XFG.23.1.3 / RV
Omicron-2 BA.2 [green]:
12% - PQ.2.8.1 / RC, PQ.17 & Nimbus NB.1.8.1 / PQ
Cicada [brown]:
8% - RE.2† & other Cicada BA.3.2
WHO-Vaccine-Target JN.1 [blue]:
6% - LF.7.9, XFZ & LF.7
Other [grey]:
6% - Other (not specified)
_____
Cicada BA.3.2 is a child of 2023 Omicron-3 BA.3.
XFV is a child of Spring 2025's FDA-Vaccine-Target LP.8.1 and left-field Stratus scion XFG.3.3.1 / SE.
[Some footnotes omitted, due to too many recombinants.]](https://media.beige.party/media_attachments/files/116/877/208/459/999/111/original/9f96fc4527cf116e.jpg)