
Login
You're viewing the front-end.social public feed.
  • Jul 6, 2026, 7:39 AM

    @fullywoolly @SnoopJ @log @ellie Speaking of finding the original article, the 1970 article by Tucker cited in the Scientific American article doesn't plot the bicycle rider! The data aren't in the table either, which only lists:

    Cherokee airplane
    Volkswagen automobile
    Cadillac automobile
    Sikorsky S62 helicopter
    Grand Commander
    F105F jet fighter
    DC 9-10 jet transport
    DC 8 jet transport
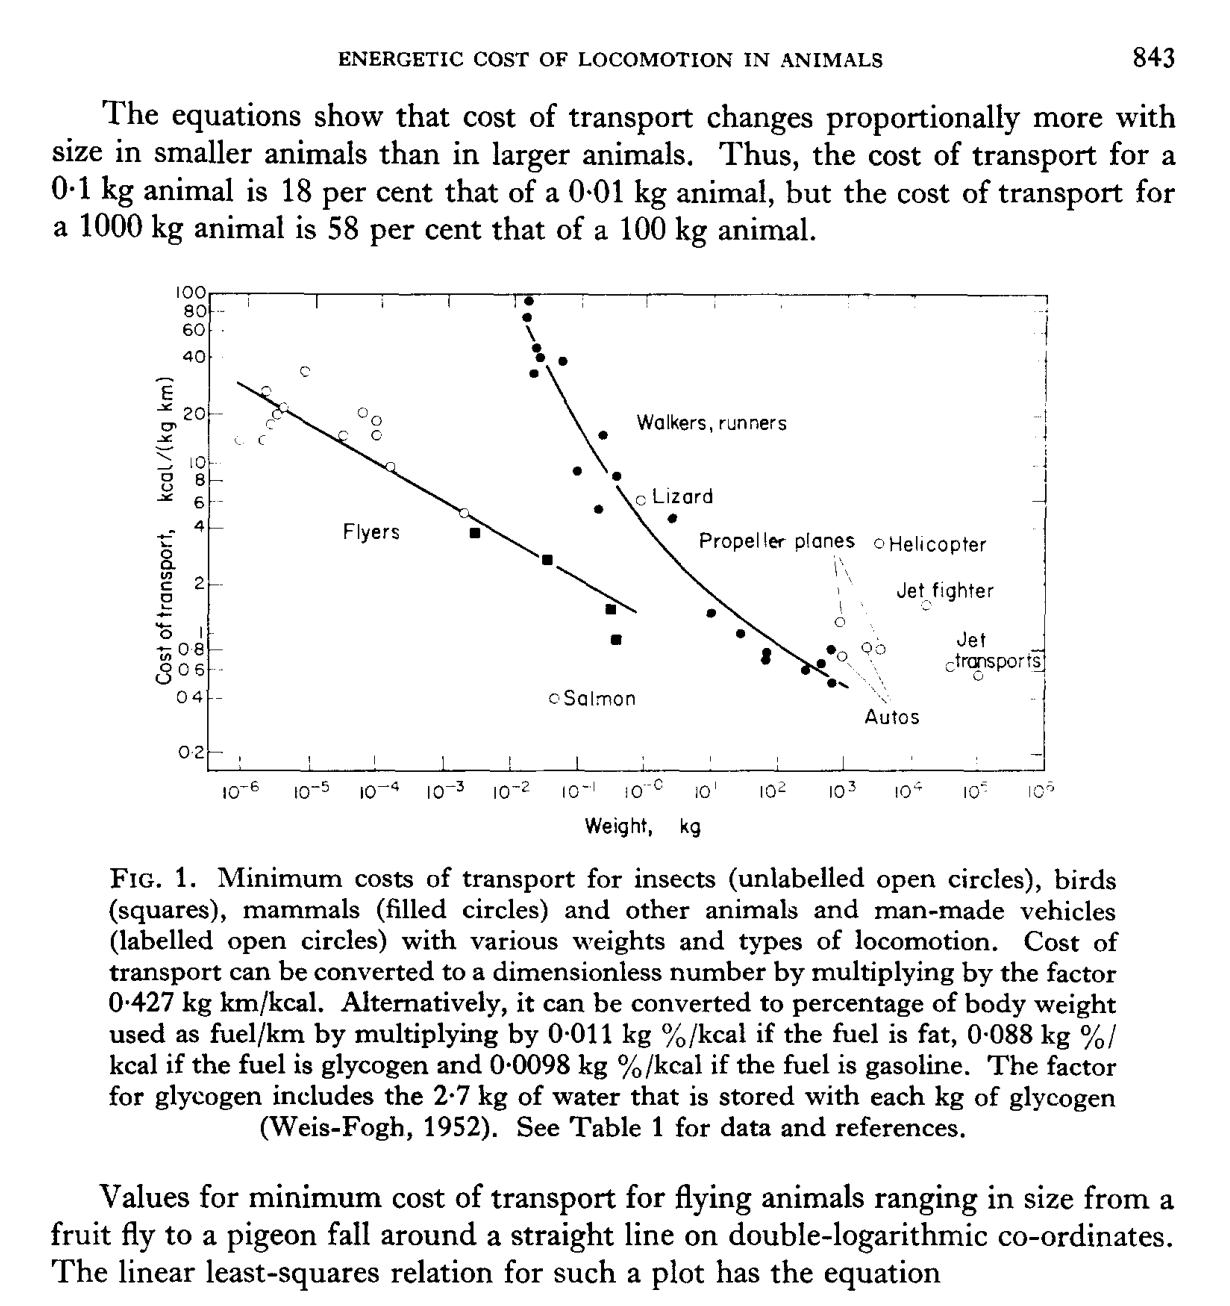
    A screenshot from page 843 of Comp. Biochem. Physiol., 1970, Vol. 34, in the article "ENERGETIC COST OF LOCOMOTION IN ANIMALS" by 
Vance A. Tucker, Department of Zoology, Duke University, Durham, North Carolina, 27706 (Received 21 October 1969) 

It reads: 

The equations show that cost of transport changes proportionally more with 
size in smaller animals than in larger animals. Thus, the cost of transport for a 
0.1 kg animal is 18 per cent that of a 0.01 kg animal, but the cost of transport for 
a 1000 kg animal is 58 per cent that of a 100 kg animal. 

FIG. 1. Minimum costs of transport for insects (unlabelled open circles), birds 
(squares), mammals (filled circles) and other animals and man-made vehicles 
(labelled open circles) with various weights and types of locomotion. Cost of 
transport can be converted to a dimensionless number by multiplying by the factor 
0.427 kg km/kcal. Alternatively, it can be converted to percentage of body weight 
used as fuel/kin by multiplying by 0"011 kg %/kcal if the fuel is fat, 0"088 kg %/ 
kcal if the fuel is glycogen and 0"0098 kg %/keal if the fuel is gasoline. The factor 
for glycogen includes the 2.7 kg of water that is stored with each kg of glycogen 
(Weis-Fogh, 1952). See Table 1 for data and references. 

Values for minimum cost of transport for flying animals ranging in size from a 
fruit fly to  pigeon fall around a straight line on double-logarithmic co-ordinates.
    💬 1🔄 0⭐ 0

Replies