Login
You're viewing the dmv.community public feed.
  • Oct 13, 2026, 9:58 PM

    New Zealand: Wastewater COVID-19 Surveillance: Week Ending 4 October 2026

    Wastewater Variant Analysis - Updated: 6 Sep 2026

    🔹XFG: (~26.9%)
    🔹PQ.16.1.1 (~26.2%)
    🔹NB.1.8.1 (~19.1%)
    🔹RF.5: (~12.6%)
    🔹BA.3.2 (~5.3%)
    🔹Recombinant (~5.0%)
    🔹JN.1 (~4.9%)

    Source: poops.nz

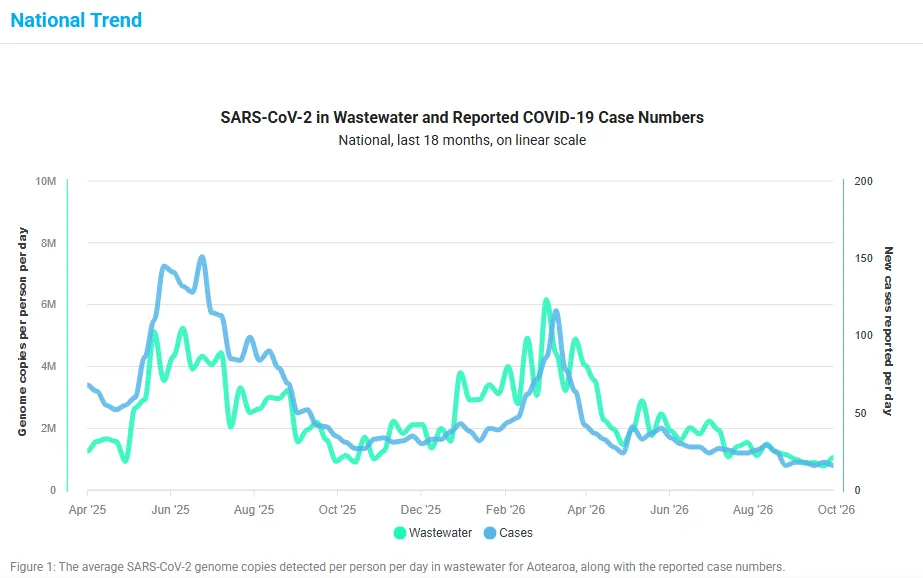
    New Zealand national SARS-CoV-2 wastewater surveillance and reported COVID-19 cases, showing trends from April 2025 to October 2026.
•	Green line: SARS-CoV-2 genome copies detected in wastewater per person per day.
•	Blue line: Reported COVID-19 cases per day.
•	May–July 2025: Major wave, with wastewater levels exceeding 5 million genome copies and reported cases peaking around 150 daily.
•	February–March 2026: Another wave, with wastewater levels peaking above 6 million and reported cases around 115 daily.
•	April–August 2026: Both indicators generally declined, with smaller fluctuations.
•	October 2026: Wastewater levels and reported cases remain relatively low, near 1 million genome copies and 10–15 cases daily.
Source: New Zealand national wastewater surveillance.
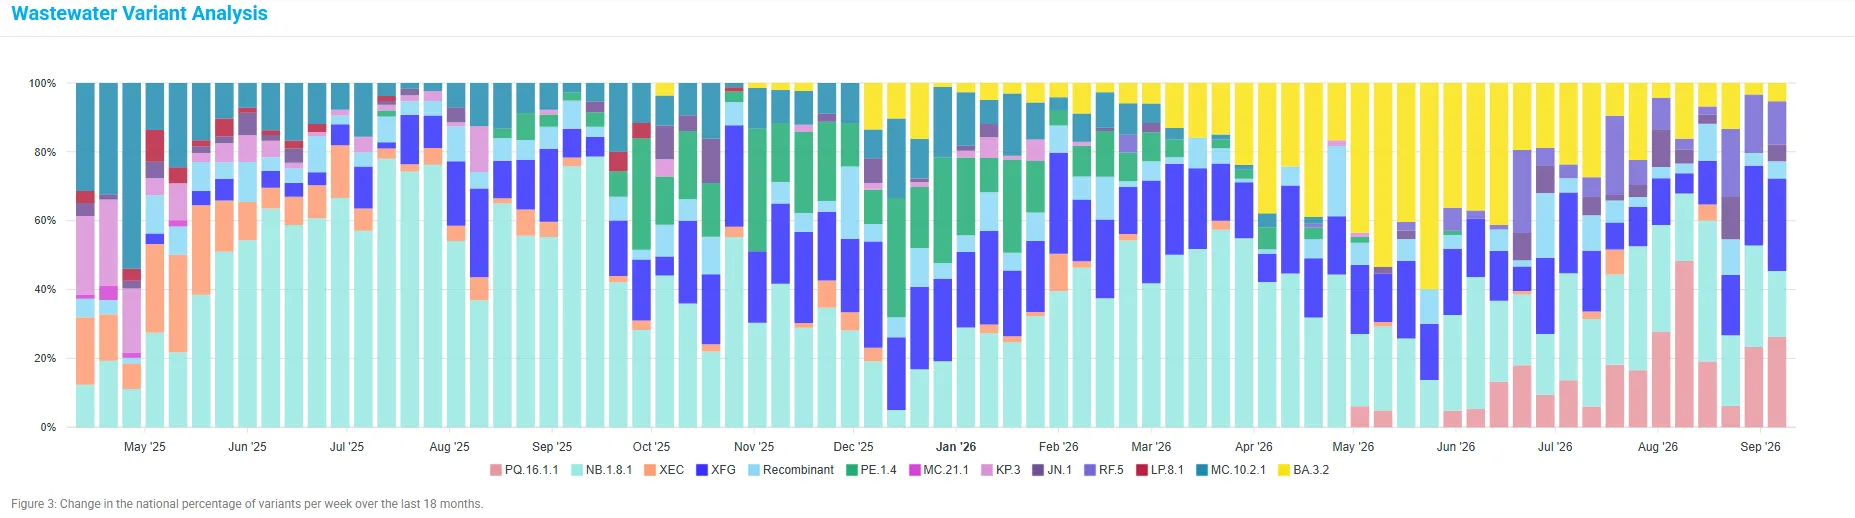
    New Zealand COVID-19 wastewater variant analysis, showing weekly variant proportions from April 2025 to September 2026. Updated 6 September 2026.
•	XFG: 26.9% (largest share).
•	PQ.16.1.1: 26.2%.
•	NB.1.8.1: 19.1%.
•	RF.5: 12.6%.
•	BA.3.2: 5.3%.
•	Recombinant variants: 5.0%.
•	JN.1: 4.9%.
•	NB.1.8.1 dominated much of 2025 before declining in 2026.
•	XFG increased during late 2025 and remained prominent throughout 2026.
•	BA.3.2 emerged in late 2025, becoming more prominent during April–June 2026 before declining.
•	PQ.16.1.1 rose sharply from June 2026, reaching approximately 26% by September.
•	Stacked coloured bars show changing variant proportions, not total infection numbers.
Source: New Zealand national wastewater surveillance.
    💬 0🔄 0⭐ 0