Login
You're viewing the discuss.systems public feed.
  • Oct 11, 2026, 10:05 PM

    🧵🇺🇸US Weekly COVID update: Oct 12, 2026

    🔸1 in 65 Actively Infectious
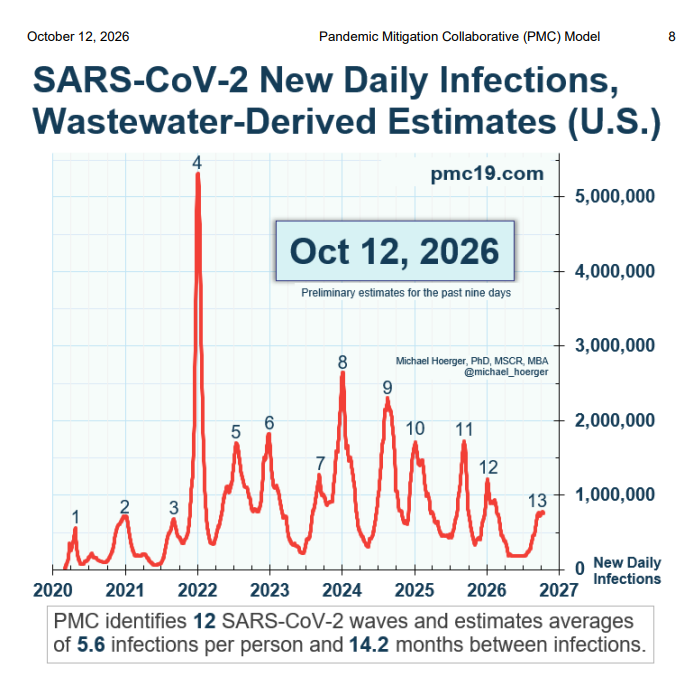
    🔸759,000 Daily Infections
    🔸5,400,000 Infections In The Past Week
    🔸137,000,000 Infections in 2026
    🔸270,000 to 1,080,000 Weekly Long COVID Cases
    🔸1,300 to 2,300 Weekly Excess Deaths

    Source: pmc19.com

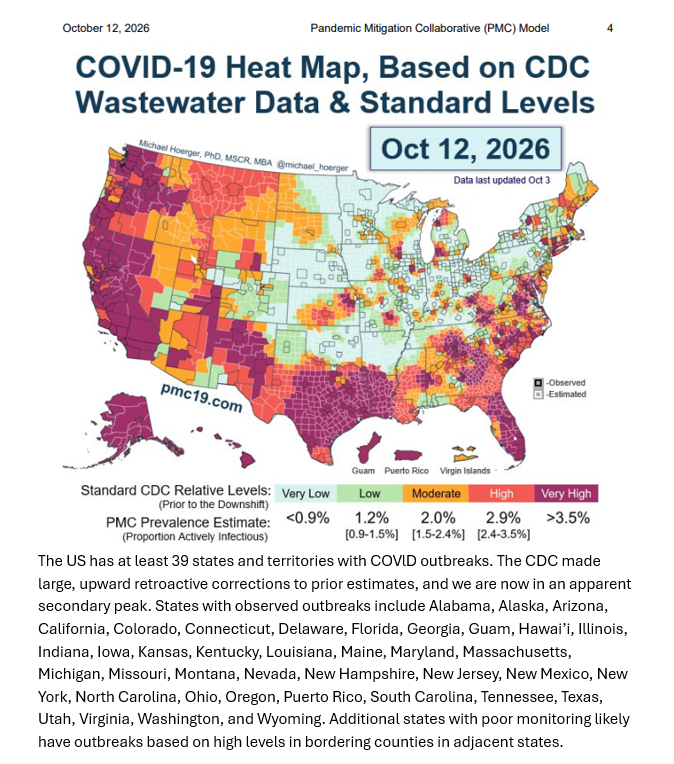
    Alt text: US COVID-19 heat map dated 12 October 2026, based on CDC wastewater data, last updated 3 October.
•	Colour scale: Very Low (light blue), Low (green), Moderate (orange), High (red), Very High (purple).
•	Estimated infection prevalence: Very Low below 0.9%; Low 1.2%; Moderate 2.0%; High 2.9%; Very High above 3.5%.
•	At least 39 states and territories reportedly have COVID outbreaks.
•	Very high levels dominate much of the West, Southwest, Texas, Florida and Alaska.
•	High and moderate levels appear across parts of the Southeast, Northeast and Mountain West.
•	Many central and northern counties show low or very low levels.
•	CDC retroactive data corrections suggest an apparent secondary peak.
•	Poor wastewater monitoring may mean additional outbreaks are being missed.
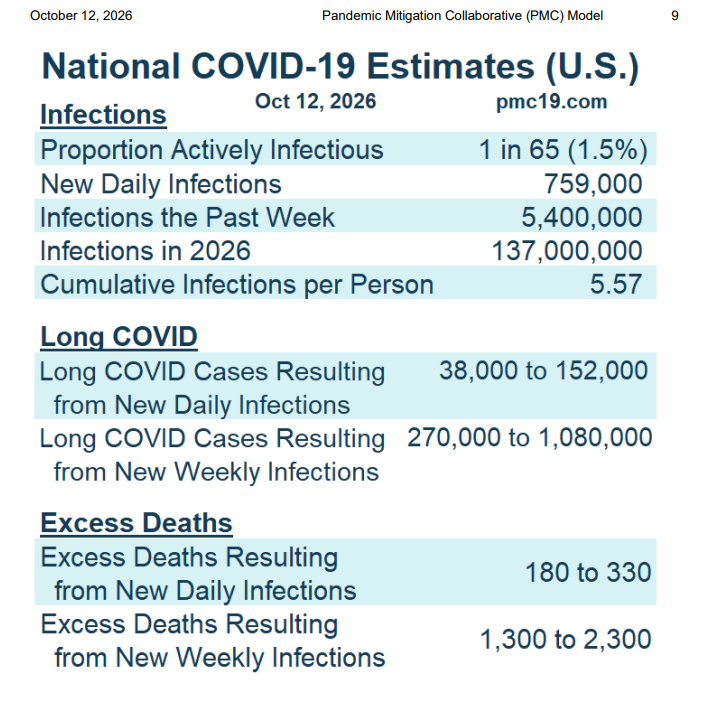
    Alt text: US National COVID-19 Estimates, 12 October 2026, from the Pandemic Mitigation Collaborative (PMC) model, pmc19.com.
Infections:
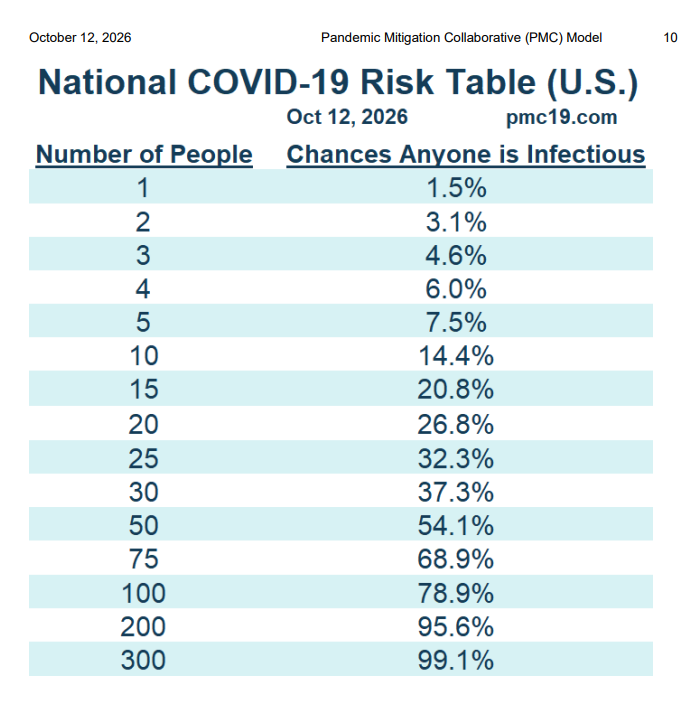
•	1 in 65 Americans (1.5%) currently infectious.
•	759,000 new infections daily.
•	5.4 million infections in the past week.
•	137 million infections estimated in 2026.
•	Average cumulative infections per person: 5.57.
Estimated Long COVID cases:
•	From daily infections: 38,000–152,000.
•	From weekly infections: 270,000–1,080,000.
Estimated excess deaths:
•	From daily infections: 180–330.
•	From weekly infections: 1,300–2,300.
Figures are modelled estimates, not confirmed case counts.
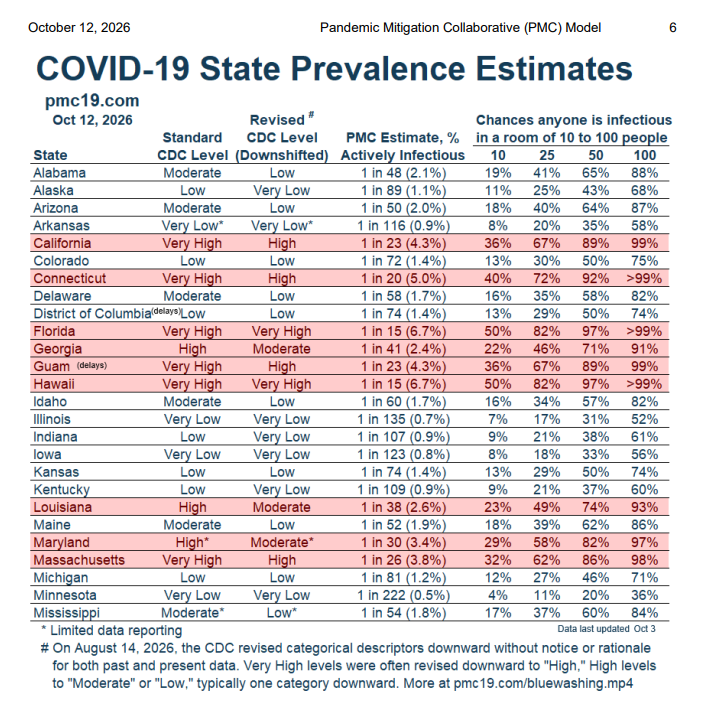
    US COVID-19 State Prevalence Estimates, 12 October 2026, from the PMC model. Table covers 25 states and territories, showing wastewater levels, estimated active infections and exposure risks.
•	Highest: Florida and Hawaii, 1 in 15 infectious (6.7%).
•	Connecticut: 1 in 20 (5.0%).
•	California: 1 in 23 (4.3%).
•	Guam: 1 in 23 (4.3%).
•	Massachusetts: 1 in 26 (3.8%).
•	Maryland: 1 in 30 (3.4%).
•	Louisiana: 1 in 38 (2.6%).
•	Georgia: 1 in 41 (2.4%).
•	Lowest: Minnesota, 1 in 222 (0.5%).
•	Other states range from 0.7% to 2.1%.
•	In Florida and Hawaii, estimated chance of someone being infectious exceeds 99% in a room of 100 people.
•	Notes: CDC revised wastewater categories downward in August 2026. Some states have limited reporting. Data last updated 3 October.
Figures are modelled estimates.
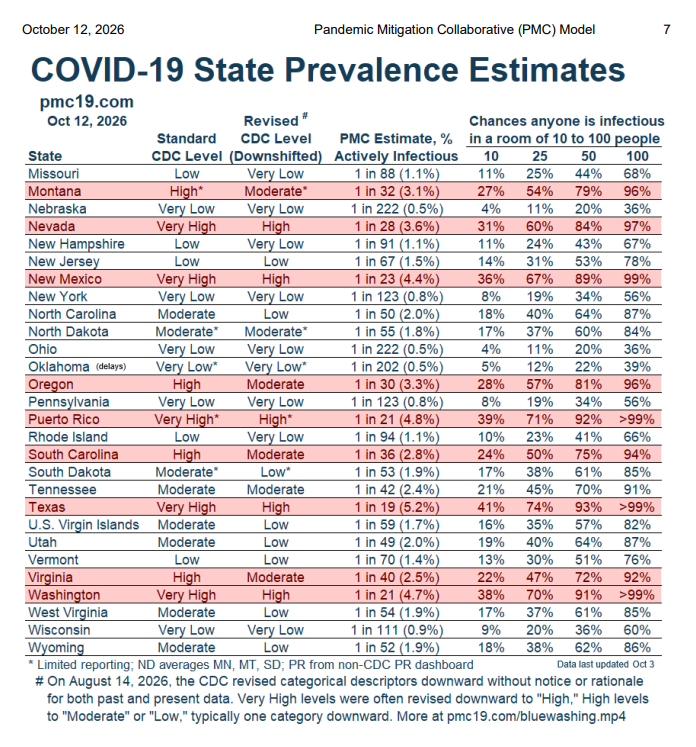
    US COVID-19 State Prevalence Estimates, 12 October 2026, from the PMC model. Table covers 25 states and territories, showing wastewater levels, estimated active infections and exposure risks.
- Highest: Texas, 1 in 19 infectious (5.2%).
- Puerto Rico: 1 in 21 (4.8%).
- Washington: 1 in 21 (4.7%).
- New Mexico: 1 in 23 (4.4%).
- Nevada: 1 in 28 (3.6%).
- Oregon: 1 in 30 (3.3%).
- Montana: 1 in 32 (3.1%).
- South Carolina: 1 in 36 (2.8%).
- Virginia: 1 in 40 (2.5%).
- Lowest: Nebraska, North Dakota and Oklahoma, 0.5%.
- In Texas, Puerto Rico and Washington, estimated exposure risk exceeds 99% in rooms of 100 people.
- CDC revised wastewater categories downward in August 2026. Some areas have limited reporting. Data updated 3 October.
Figures are modelled estimates.
    💬 3🔄 4⭐ 0

Replies