 Jun 11, 2025, 3:17 AM
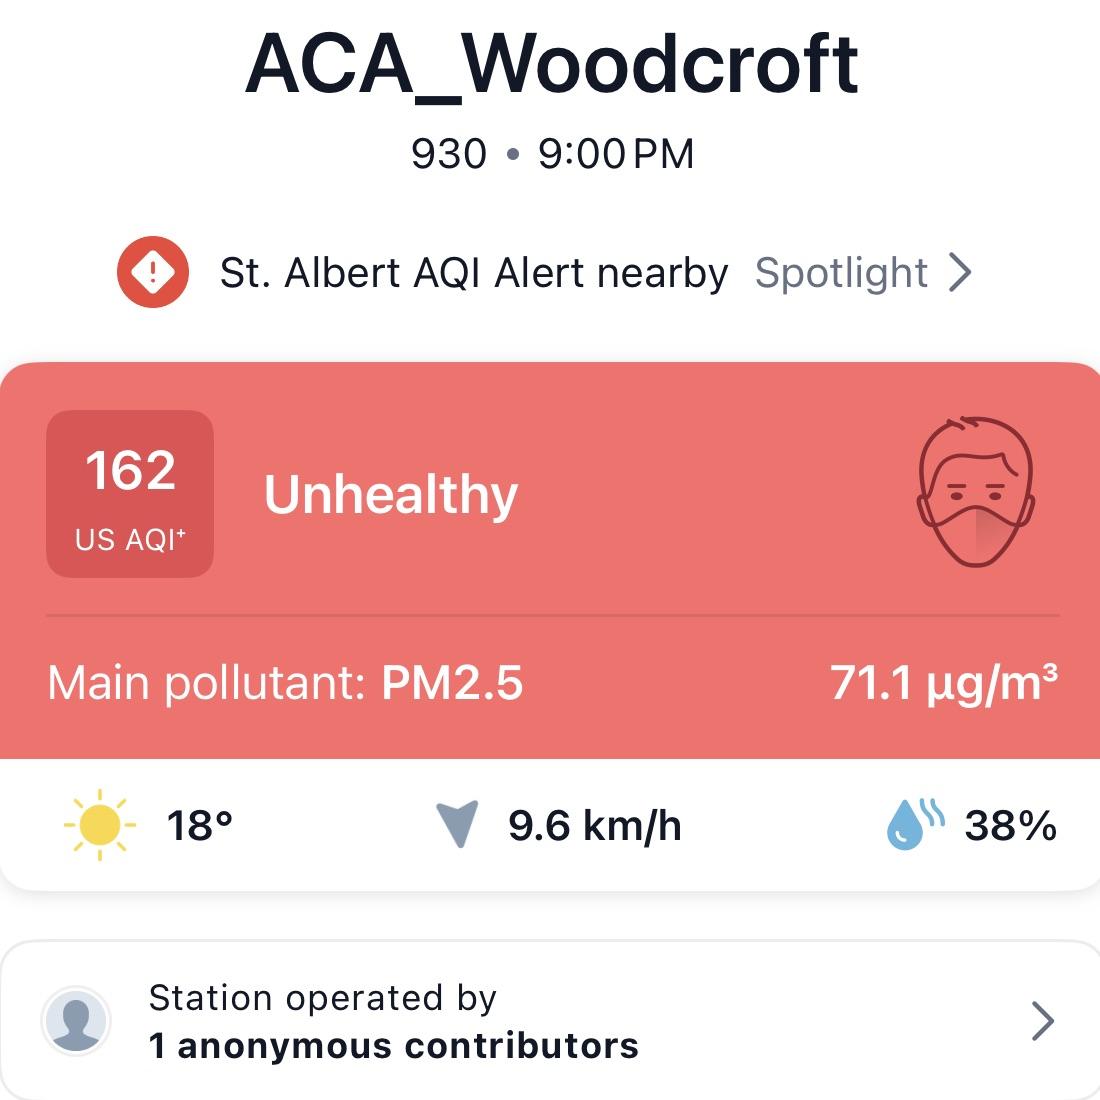
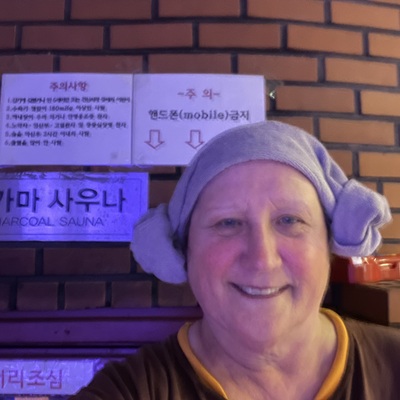
The smoke just seemed to get stronger so checked my AQI app. Sure enough.
My closest station reads 162. I have seen higher but still unhealthy.
1/3
 Jun 11, 2025, 3:17 AM
The smoke just seemed to get stronger so checked my AQI app. Sure enough.
My closest station reads 162. I have seen higher but still unhealthy.
1/3
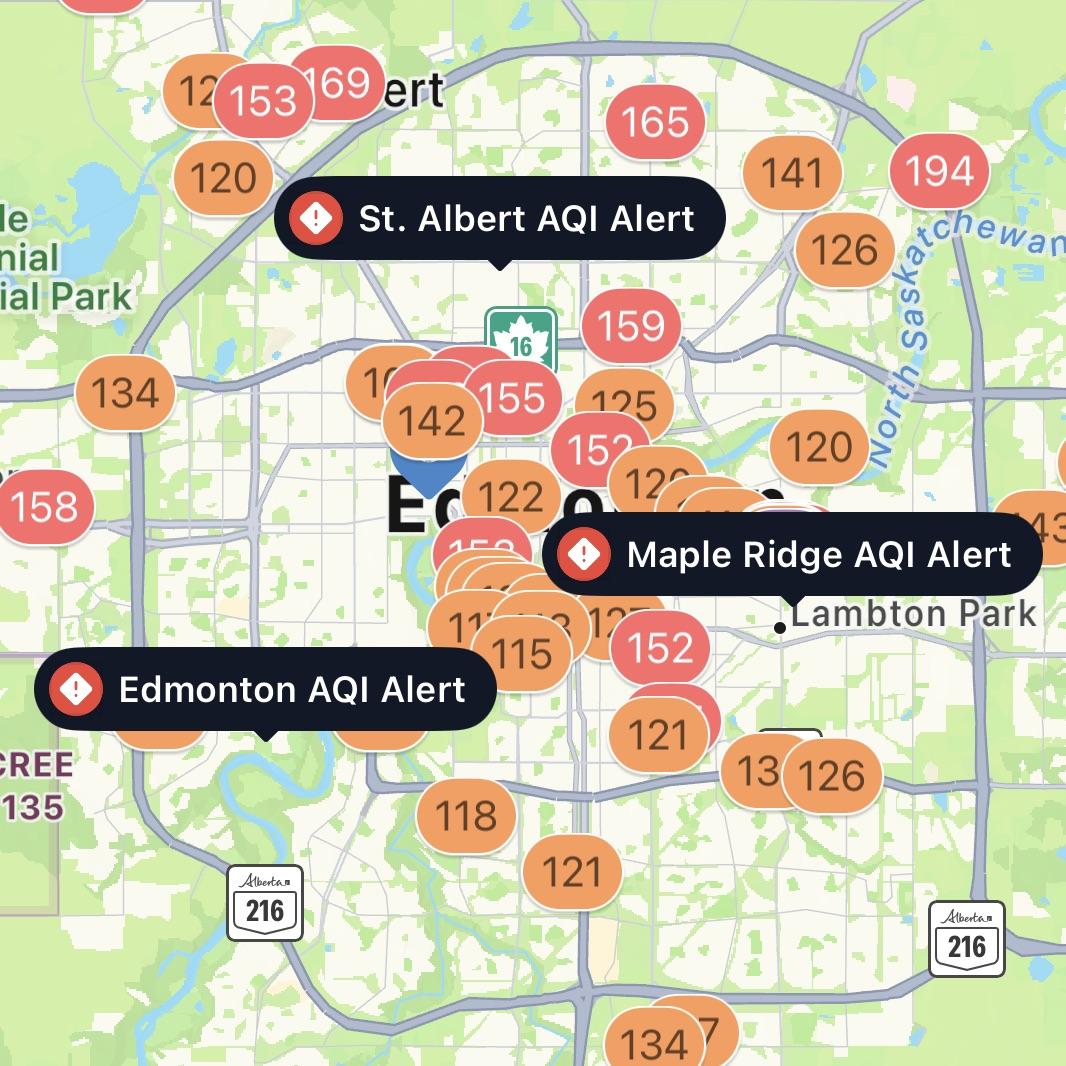
Jun 11, 2025, 3:19 AMFrom the same app, here is a view across the city of Edmonton. Most reading are in the 100 to 200 range.
2/3
 Jun 11, 2025, 3:25 AM
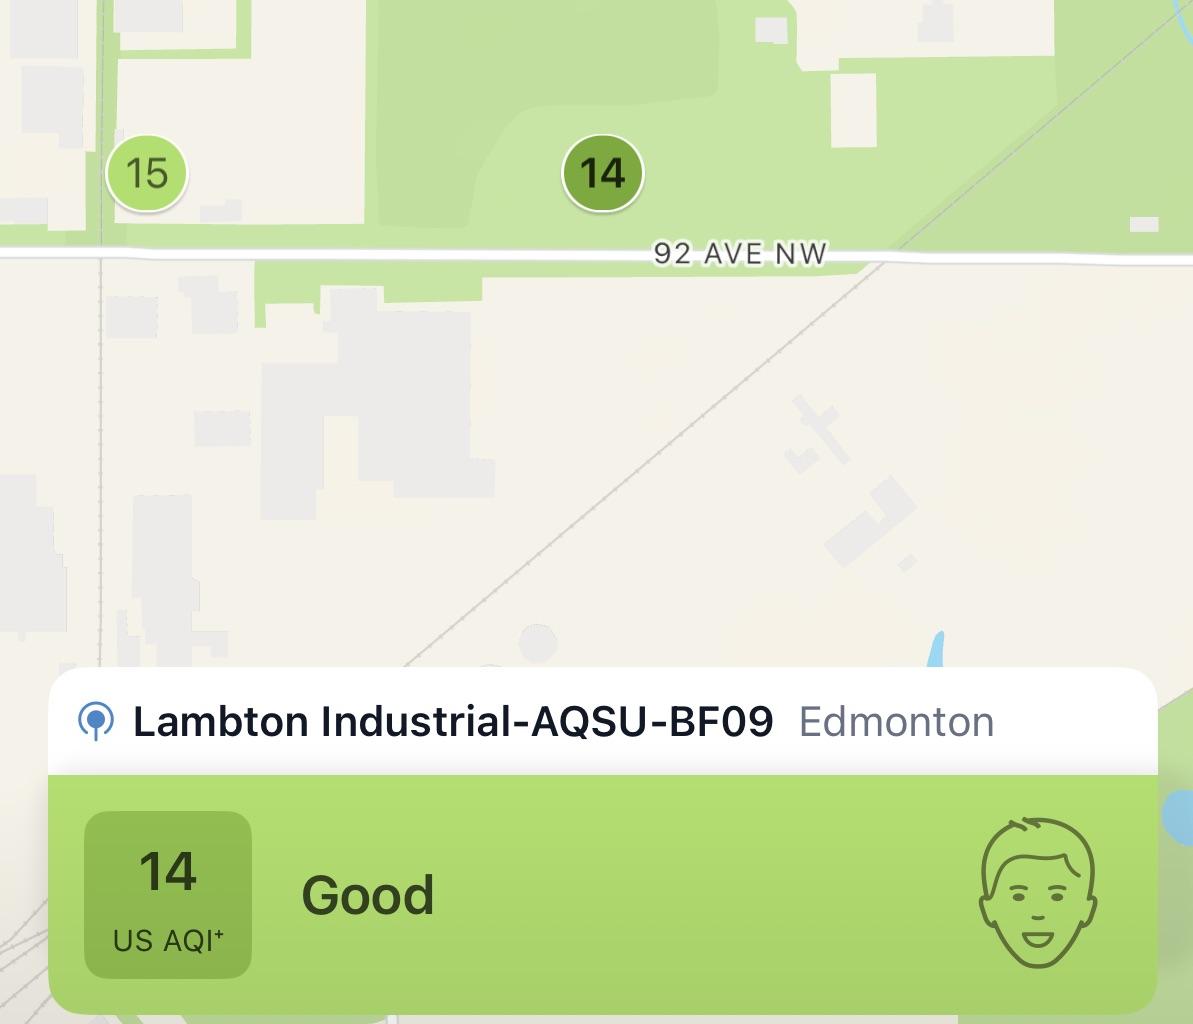
However, in the city there are two station which perhaps need some calibration. They were at 3 and 2 earlier. Now, they have made it up to 15 and 14. The ONLY two stations down there in the green.
Reading 14 now when you can see the haze of smoke against the houses across the street is laughable. Perhaps they think they can push the average down doing this. A Q test would toss these data points out.
3/3
@lauxmyth
Just ignore the green anomalies because those are probably the readings from an indoor AQI monitor. Lambton Park readings are always some of the worst in the city.
Jun 11, 2025, 11:28 AM@EllenInEdmonton
If the geolocation is correct, they are not inside. Still, that might be the reason for the errors. They are consistent and slightly amusing.
 Jun 11, 2025, 11:34 AM
What app are you using?
Jun 11, 2025, 1:32 PM@DiverDoc
App is AirVisual on iPhone but seems to draw from a network called IQAir. I cannot look to see if out there on other platforms.
 Jun 11, 2025, 1:51 PM
@lauxmyth Thanks!
Jun 11, 2025, 2:05 PM@lauxmyth There is another really good one called Windy that is VERY detailed and is available on ?all platforms including desktop.
Jun 16, 2025, 3:29 AM@DiverDoc
I tried windy.app and seemed to want so much from me I gave up.
Jun 11, 2025, 2:11 PM@lauxmyth Another good one is:
https://firesmoke.ca/forecasts/current/